If You Could Only Pick One Report…
I was reading Google Analytics’ Conversion University an article by Jim Novo where he discusses the metric he would look at if he could only pick one. The metric he talks about is % of one-page visits (of total visits). I like his choice of a metric, but I’d like to expand on it with a custom report you can make in Google Analytics.
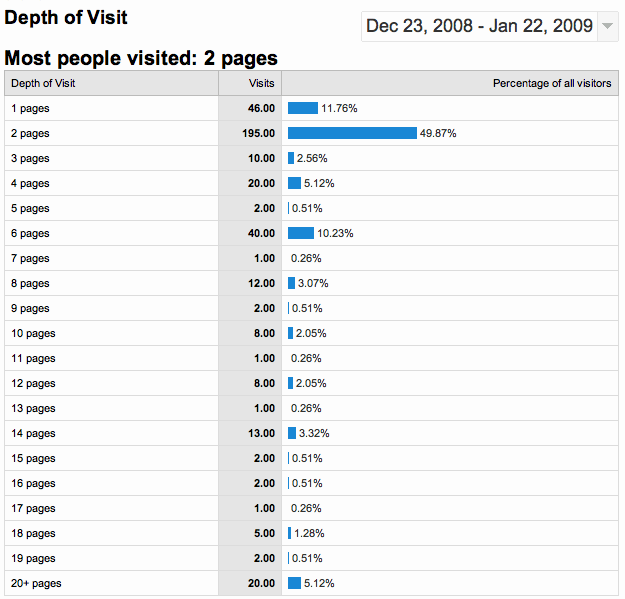
You can view the overall “Depth of Visit” by going to Visitors > Visitory Loyalty > Depth of Visit. This gives you a great feel for how many pages visitors are hitting before they go somewhere else.
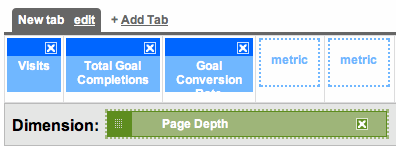
This is useful information, but it doesn’t tell us what is happening on the bottom line, about who is making us money or not. So, let’s turn to a custom report, which I call “Goals by Page Depth”:
Here we are focusing on “Page Depth” but will be able to see how it performs in terms of converting (using our Goals).
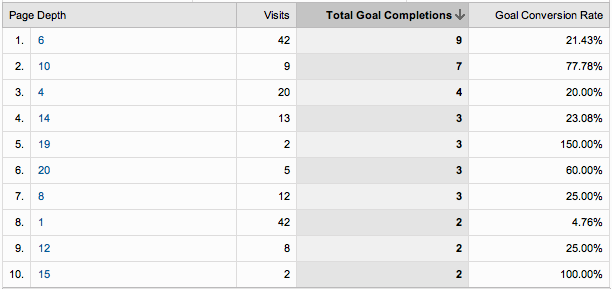
Looking at this data we now where I have the most visits with 2 page depths I have very few conversions. It takes 6, 10, 4, 14, and 19 pages for most to take the step to send me their contact information (my goal). Interestingly there are 7 pages in the main menu, so maybe they go to almost every one of those first?
This is a really handy report because it gives an overall view of how we’re doing to capture our audience. We’d really like to see more of the one, two or three page visits converting to a goal completion, because that would mean we are effectively persuading them and targeting our market.
Looks like I have some work to do on this site, and you have a custom report to build!
Category: Custom Reports


